
About Me
Hi, I'm Ariful Mondal. I am a data professional focused on converting messy enterprise numbers into interactive dashboards, automated intelligence, and clear operational strategies. My approach bridges deep mathematical analysis with real-world execution, helping organizations unlock key patterns and minimize revenue leakage.
With hands-on experience navigating supply chain and professional operations, I focus heavily on operational data analytics. I specialize in building complete descriptive pipelines—transforming raw business data into structured SQL databases and designing dynamic Power BI reports that track key performance metrics at a glance. My expertise lies in parsing historical metrics, performing target segment analysis, and turning complex metrics into simple stories that guide executive decisions.
While data analysis and business intelligence are my core focus, I actively extend these insights into data science and predictive analytics using Python, NumPy, and Pandas to write automated clean-up logic and engineer high-performance machine learning models.
Featured Projects
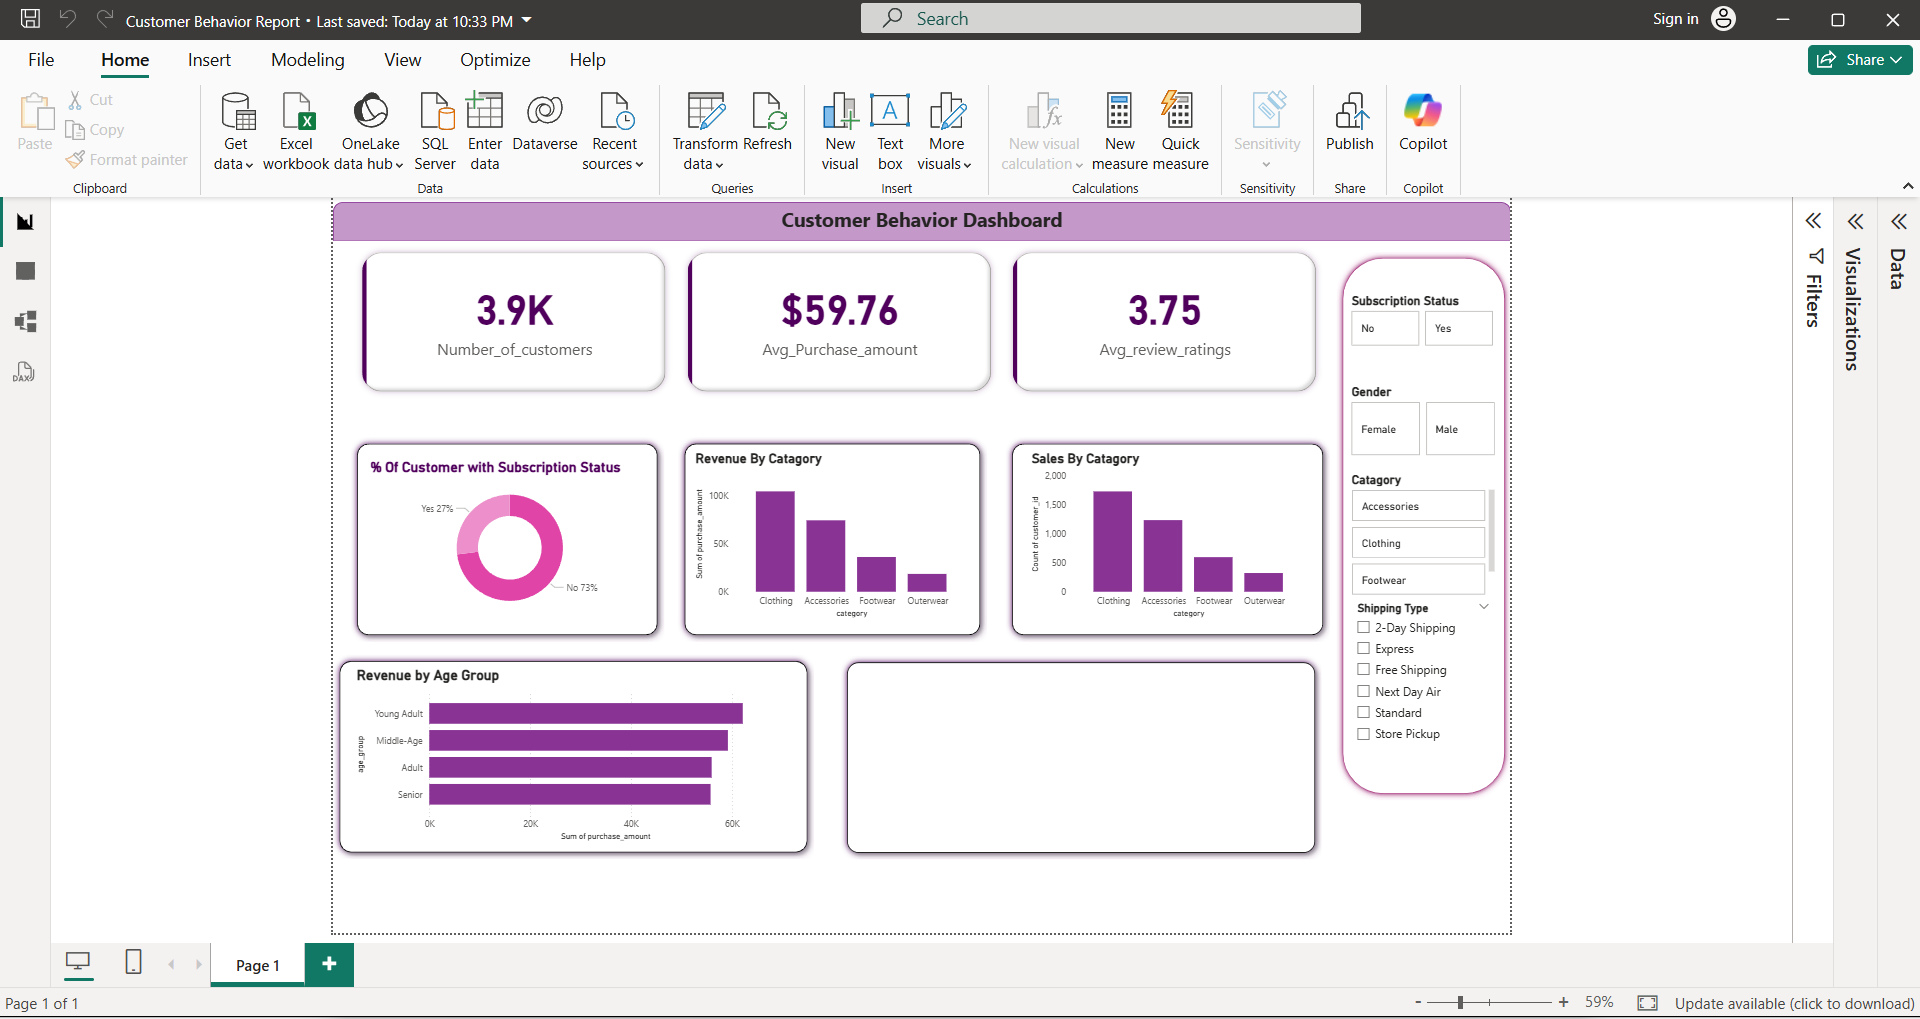
Customer Shopping Behavior
End-to-end Python-to-MySQL pipeline analyzing 3,900 accounts & $233K revenue. Power BI dashboard proved 76% of revenue comes from Clothing & Accessories.
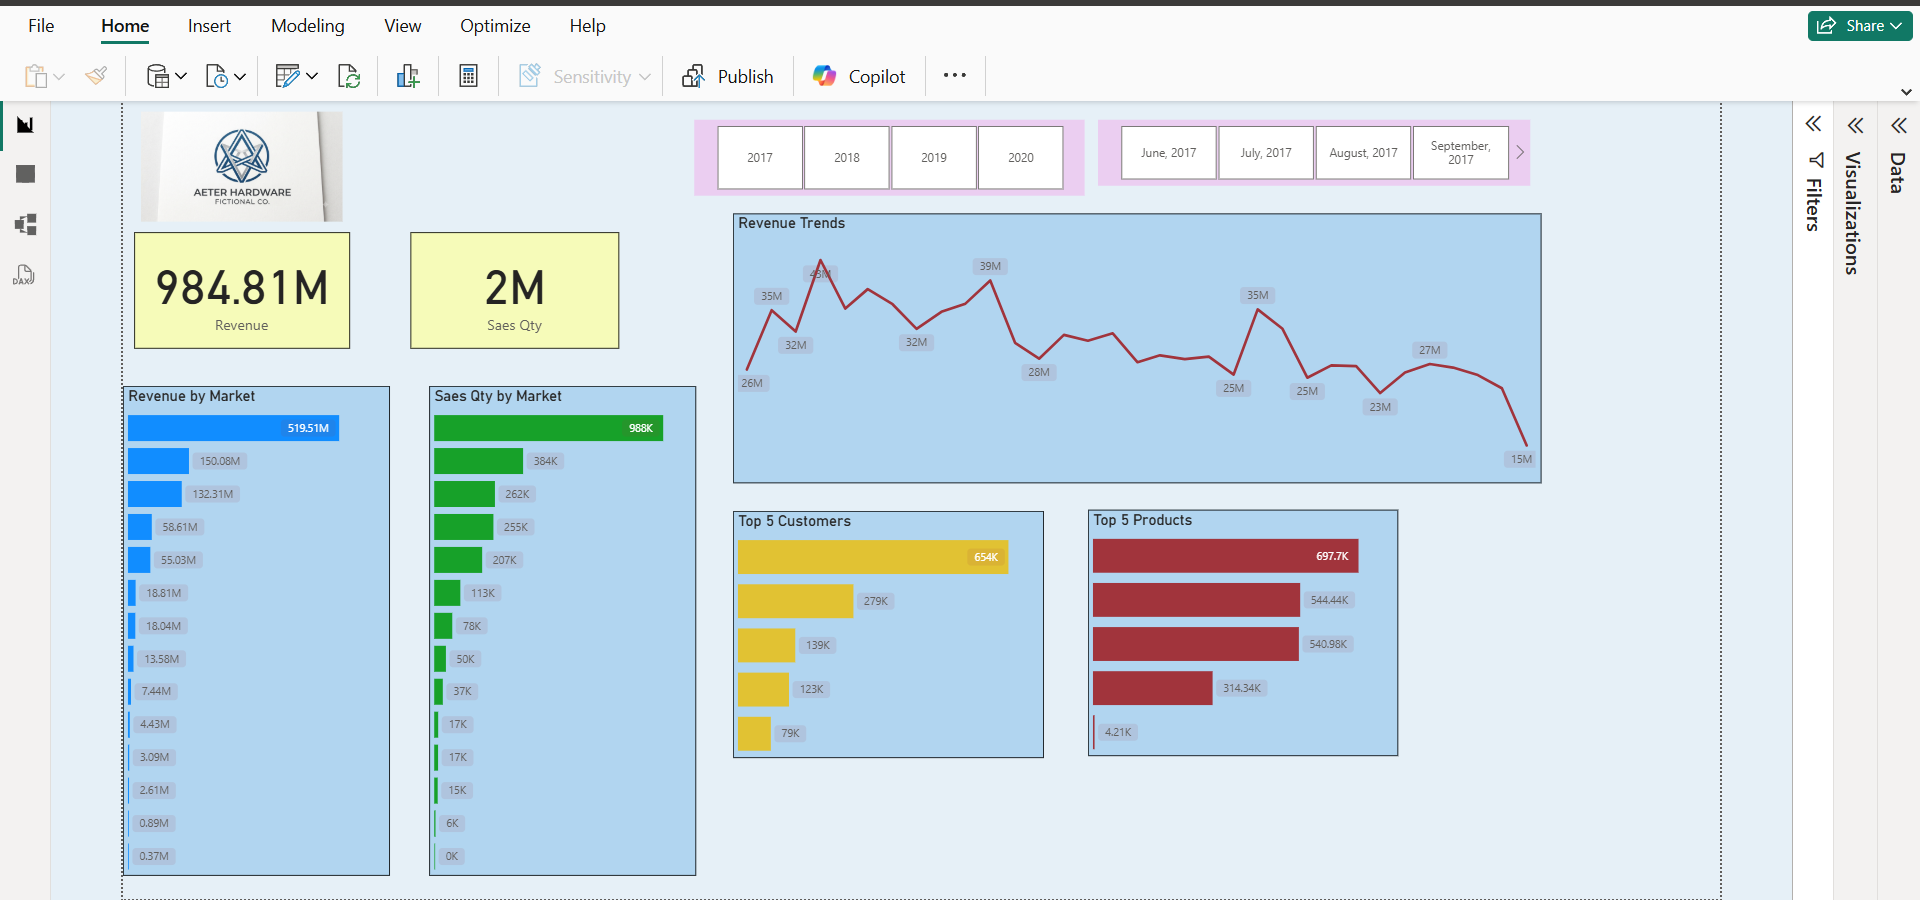
Revenue Analysis & Forecasting
Comprehensive Power BI dashboard analyzing corporate revenue streams, regional sales performance, and high-margin product categories to optimize business growth.
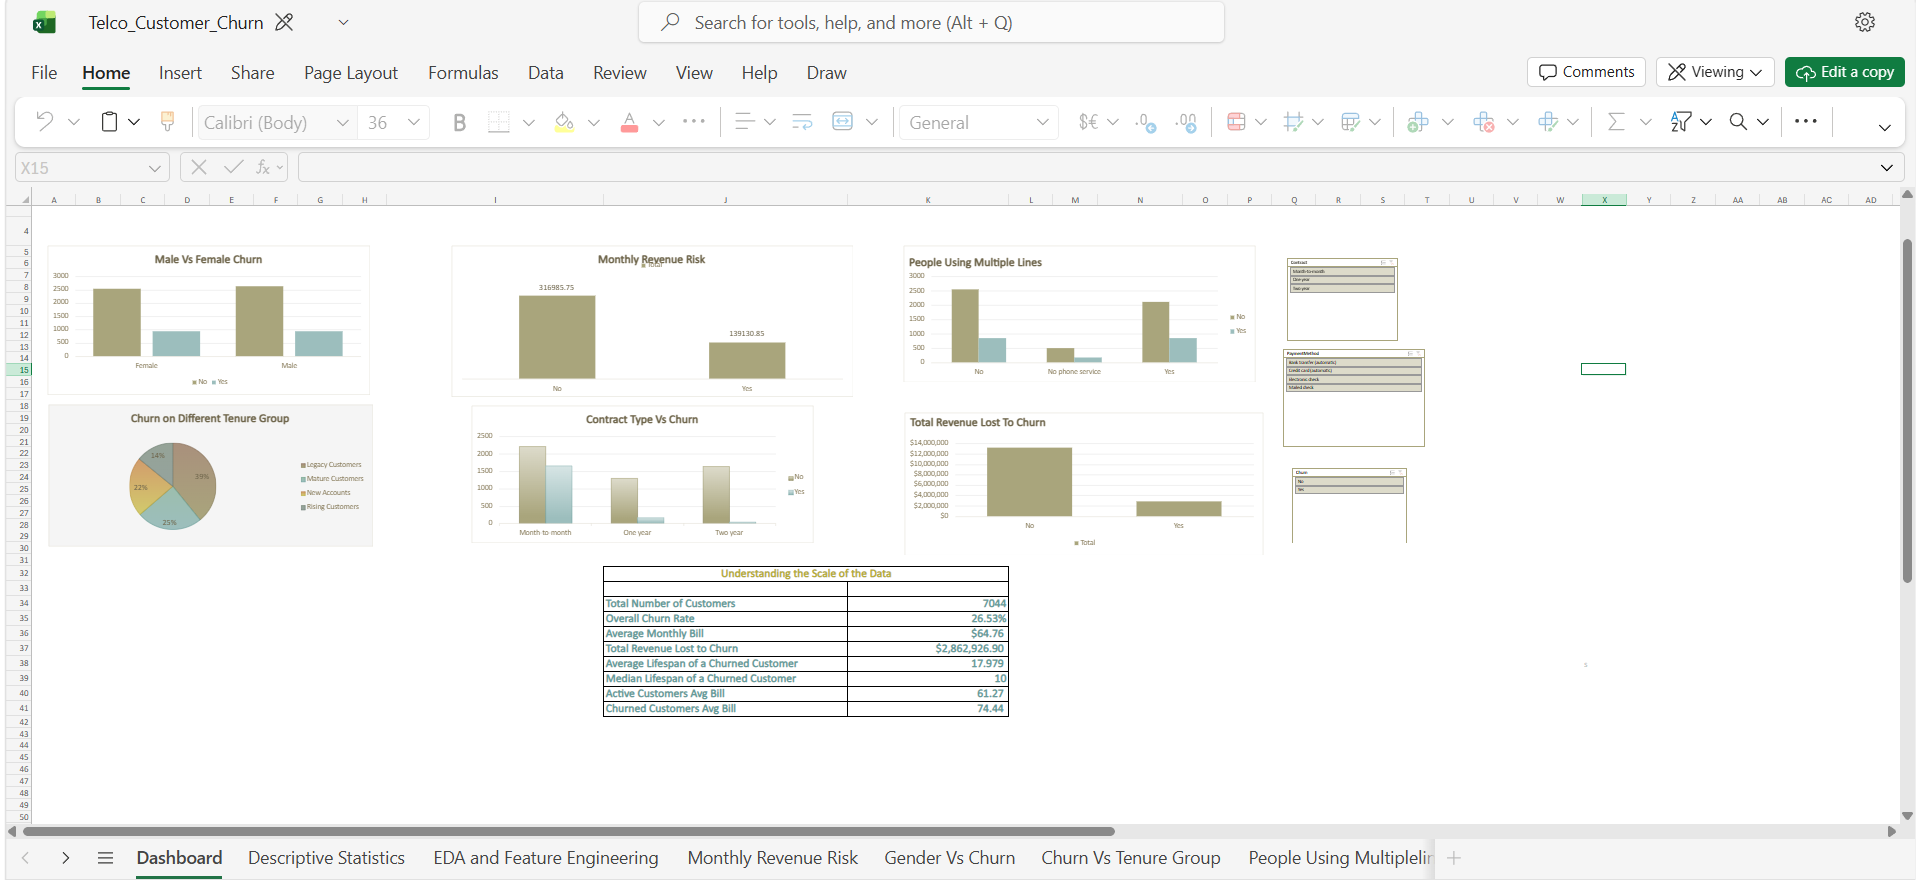
Telecom Churn Analysis
Multi-slicer dashboard tracking a 26.53% portfolio churn rate. Isolated $2.86M revenue leakage and diagnosed a 10-month median customer lifespan risk corridor.
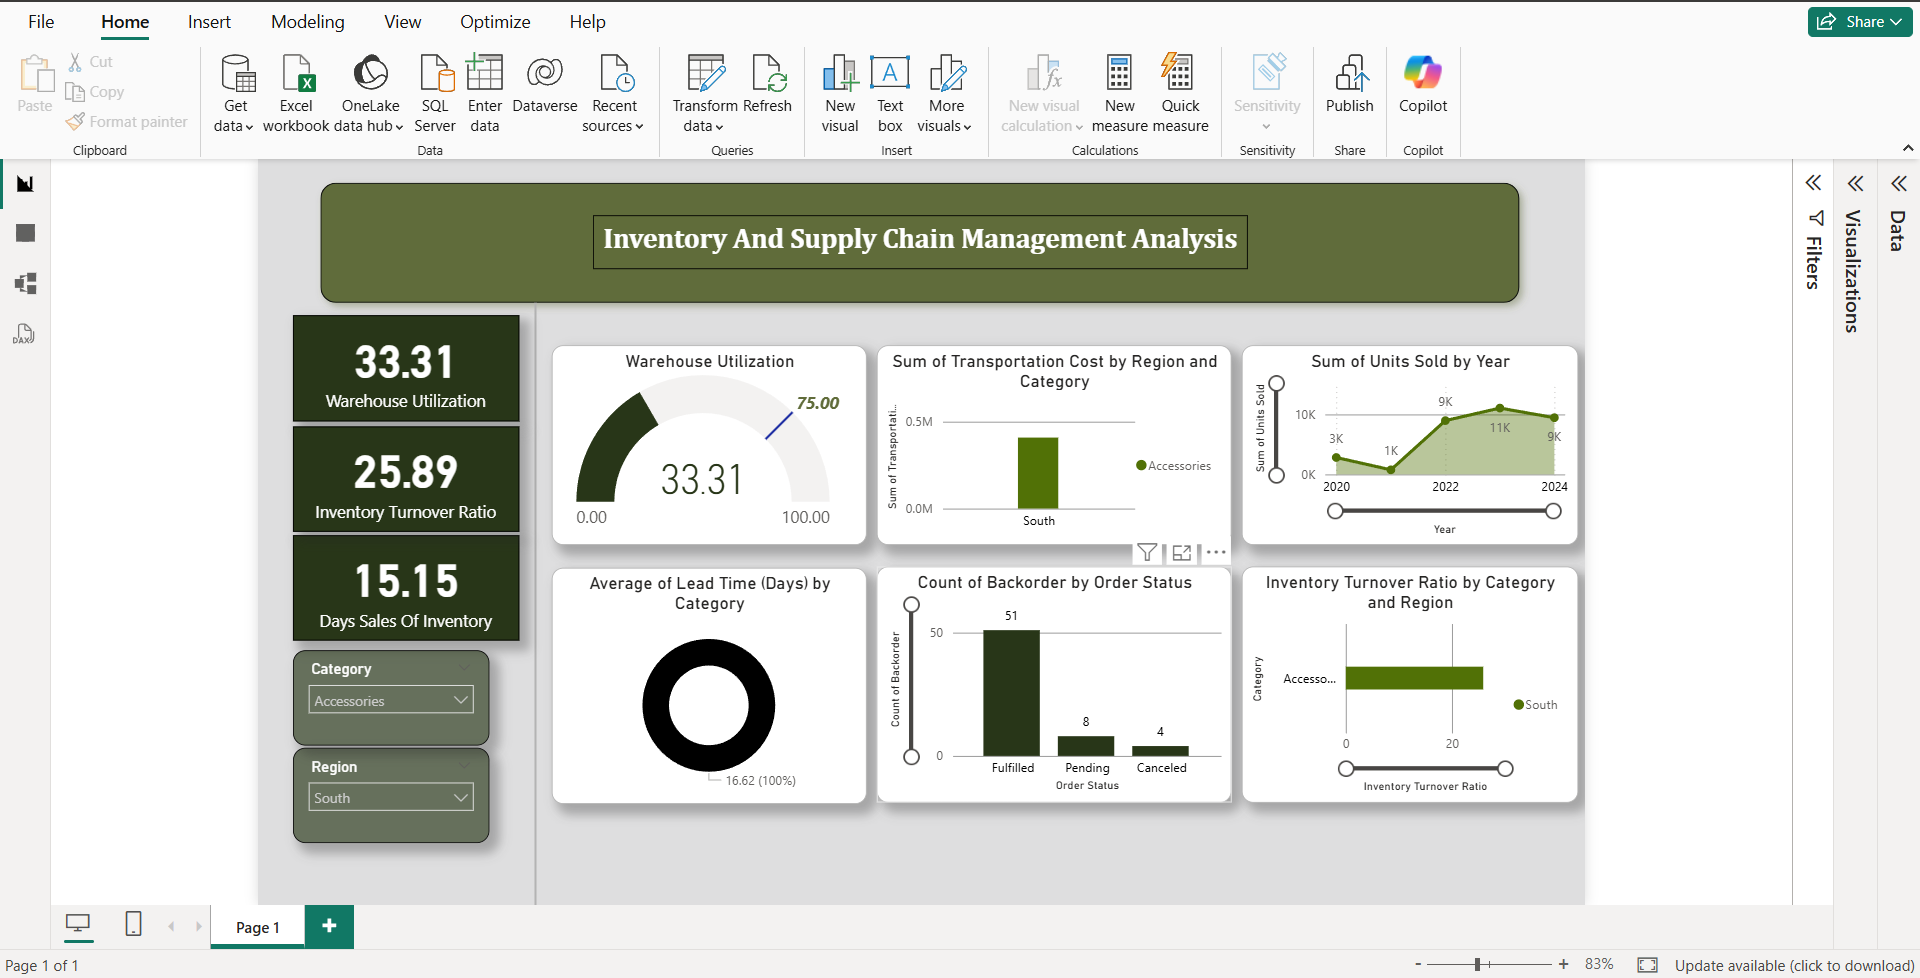
Inventory & Supply Chain
Data-driven strategies to reduce stockouts by 12% using historic portfolio trends. Built on 2+ years of professional supply chain experience.
HR Analytics Dashboard
Identified 3 critical enterprise factors directly contributing to employee attrition metrics through an interactive Power BI dashboard.
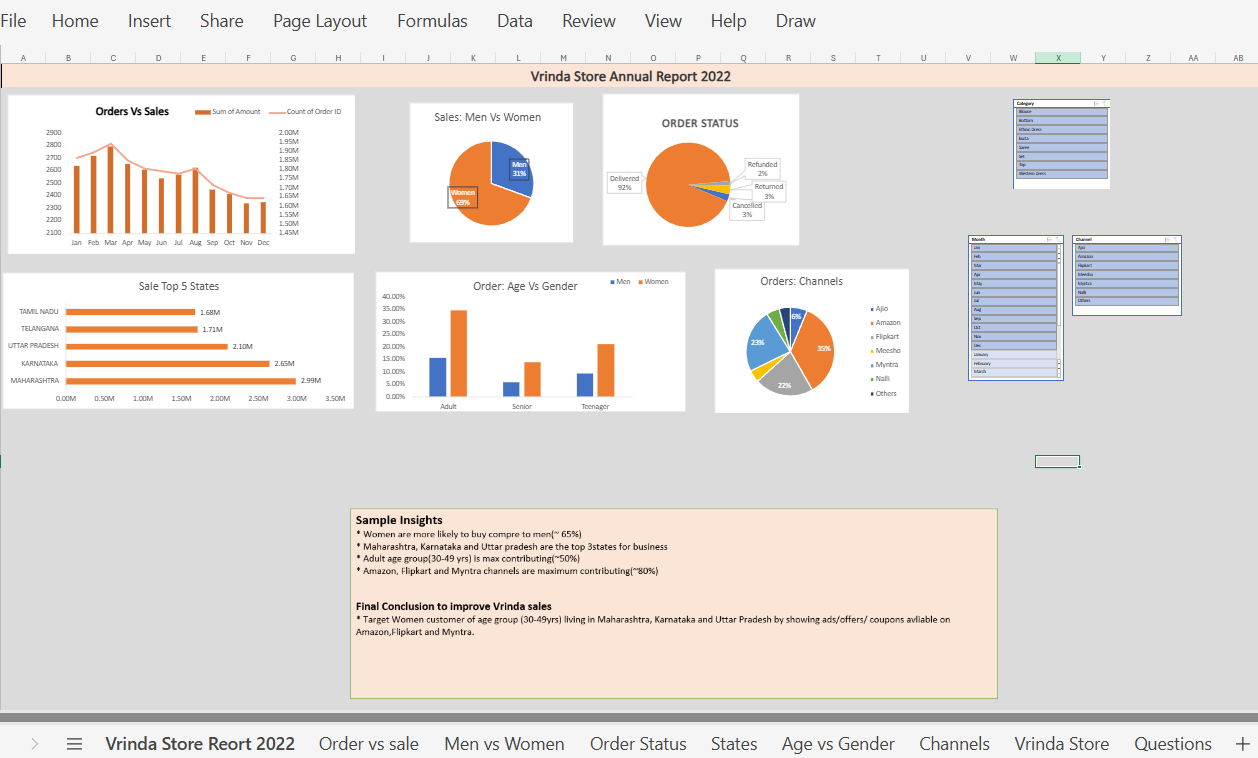
Sales & Revenue Analytics
Automated reporting pipelines using Power Query and Pivot Tables to uncover seasonal revenue trends and streamline executive reporting.
Gold Price Prediction — ML
Forecasting asset valuations using Random Forest Regressor, achieving a high-accuracy R² score of 0.92. Pipeline covers ingestion, feature selection, and evaluation.
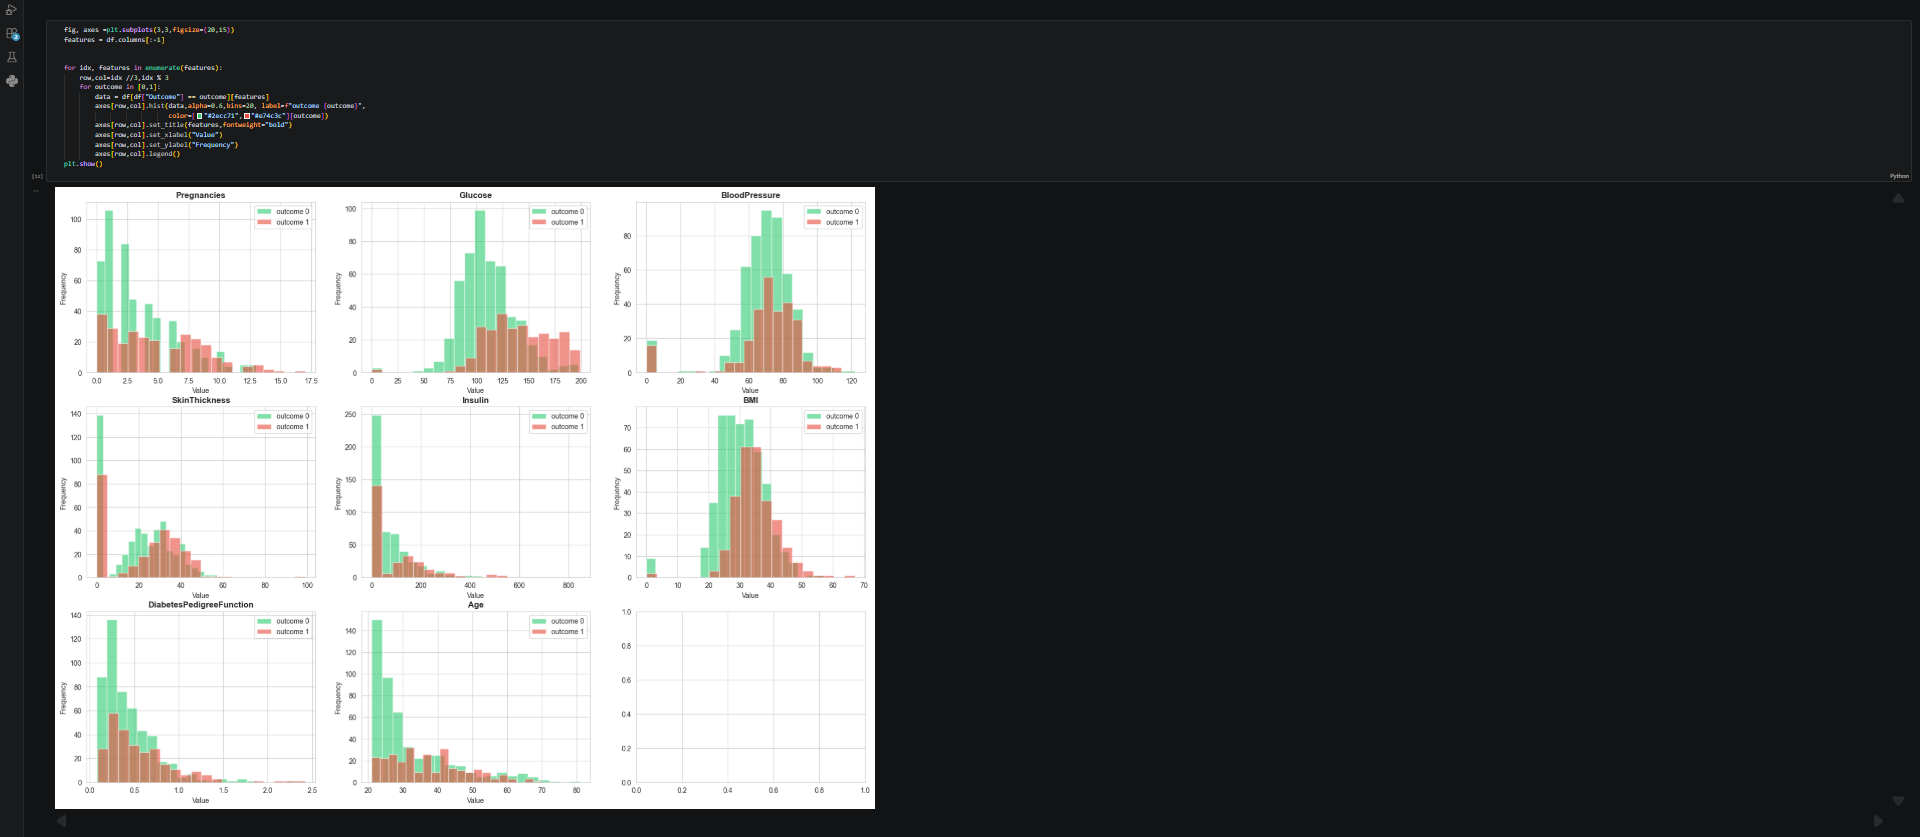
Diabetes Prediction — ML
Predictive modeling pipeline using clinical indicators (Glucose, BMI, Age) to assess diabetic risk. Includes Joblib model serialization for deployment-ready output.
Sonar Rock vs. Mine — Deep Learning
Achieved 85% accuracy in high-frequency acoustic signal categorization using an ANN. Processes sonar returns to distinguish rock from metal cylinders.
ANN Classification — Deep Learning
Engineered an ANN architecture optimized for multi-feature binary classification. Covers layer design, activation tuning, and performance evaluation.
Interactive Lab: Data Runner
dodge the noise. collect the signal. (SPACE/TAP to start)
Full Projects Showcase
1. Customer Shopping Behavior
Architecture to analyze consumer purchasing trends across 3,900 accounts ($233K revenue). Python-to-MySQL pipeline with Power BI dashboard.
2. Telecom Customer Churn
Corporate analytical app tracking a 26.53% churn rate and isolated $2.86M revenue leakage.
3. Inventory & Supply Chain
Proposed data-driven strategies to reduce stockouts by 12% leveraging historic portfolio trends.
4. HR Analytics Dashboard
Identified 3 critical enterprise factors directly contributing to employee attrition metrics.
5. Sales & Revenue Analytics
Built automated reporting pipelines via Power Query to uncover seasonal revenue trends.
6. ServiceNow Leave Management
Scoped application to orchestrate automated employee absence requests with approval workflows.
7. Gold Price Prediction
Forecasting engine using Random Forest Regressor achieving an R² score of 0.92.
8. Sonar Rock vs. Mine
Achieved 85% accuracy in high-frequency acoustic signal categorization using an ANN.
9. Deep Learning ANN
Engineered an ANN architecture optimized for multi-feature binary classification challenges.
10. Diabetes Prediction
Predictive modeling pipeline using clinical indicators (Glucose, BMI, Age) to identify risk factors.
11. Heart Disease Prediction
Binary classification using clinical features like cholesterol and blood pressure to assess cardiovascular risk.
12. Feature Engineering
Implementation of preprocessing pipelines, feature scaling, encoding mechanics, and transformation logic.
13. Machine Learning Pipelines
End-to-end deployment workflows connecting raw data ingestion, feature extraction, model tuning, and evaluation.
Revenue Analysis & Forecasting
End-to-end ETL pipeline and interactive dashboard analyzing regional sales performance, product profit margins, and customer retention trends.